|
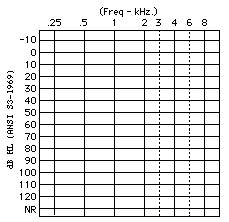
To this point in this section
we have been viewing thresholds plotted in dB SPL. The graph shown
here is obviously an audiogram and is also used for potting pure tone
thresholds. Note that the vertical scale is still dB but is now defined
as dB HL instead of dB SPL. Note also that the graph has been
inverted compared to the previous graph. The lower dB values are plotted
towards the top. |
 |
|